TUI
The TUI lets you browse tests, run all or some of them, and inspect every HTTP or gRPC call they made, without leaving the terminal.
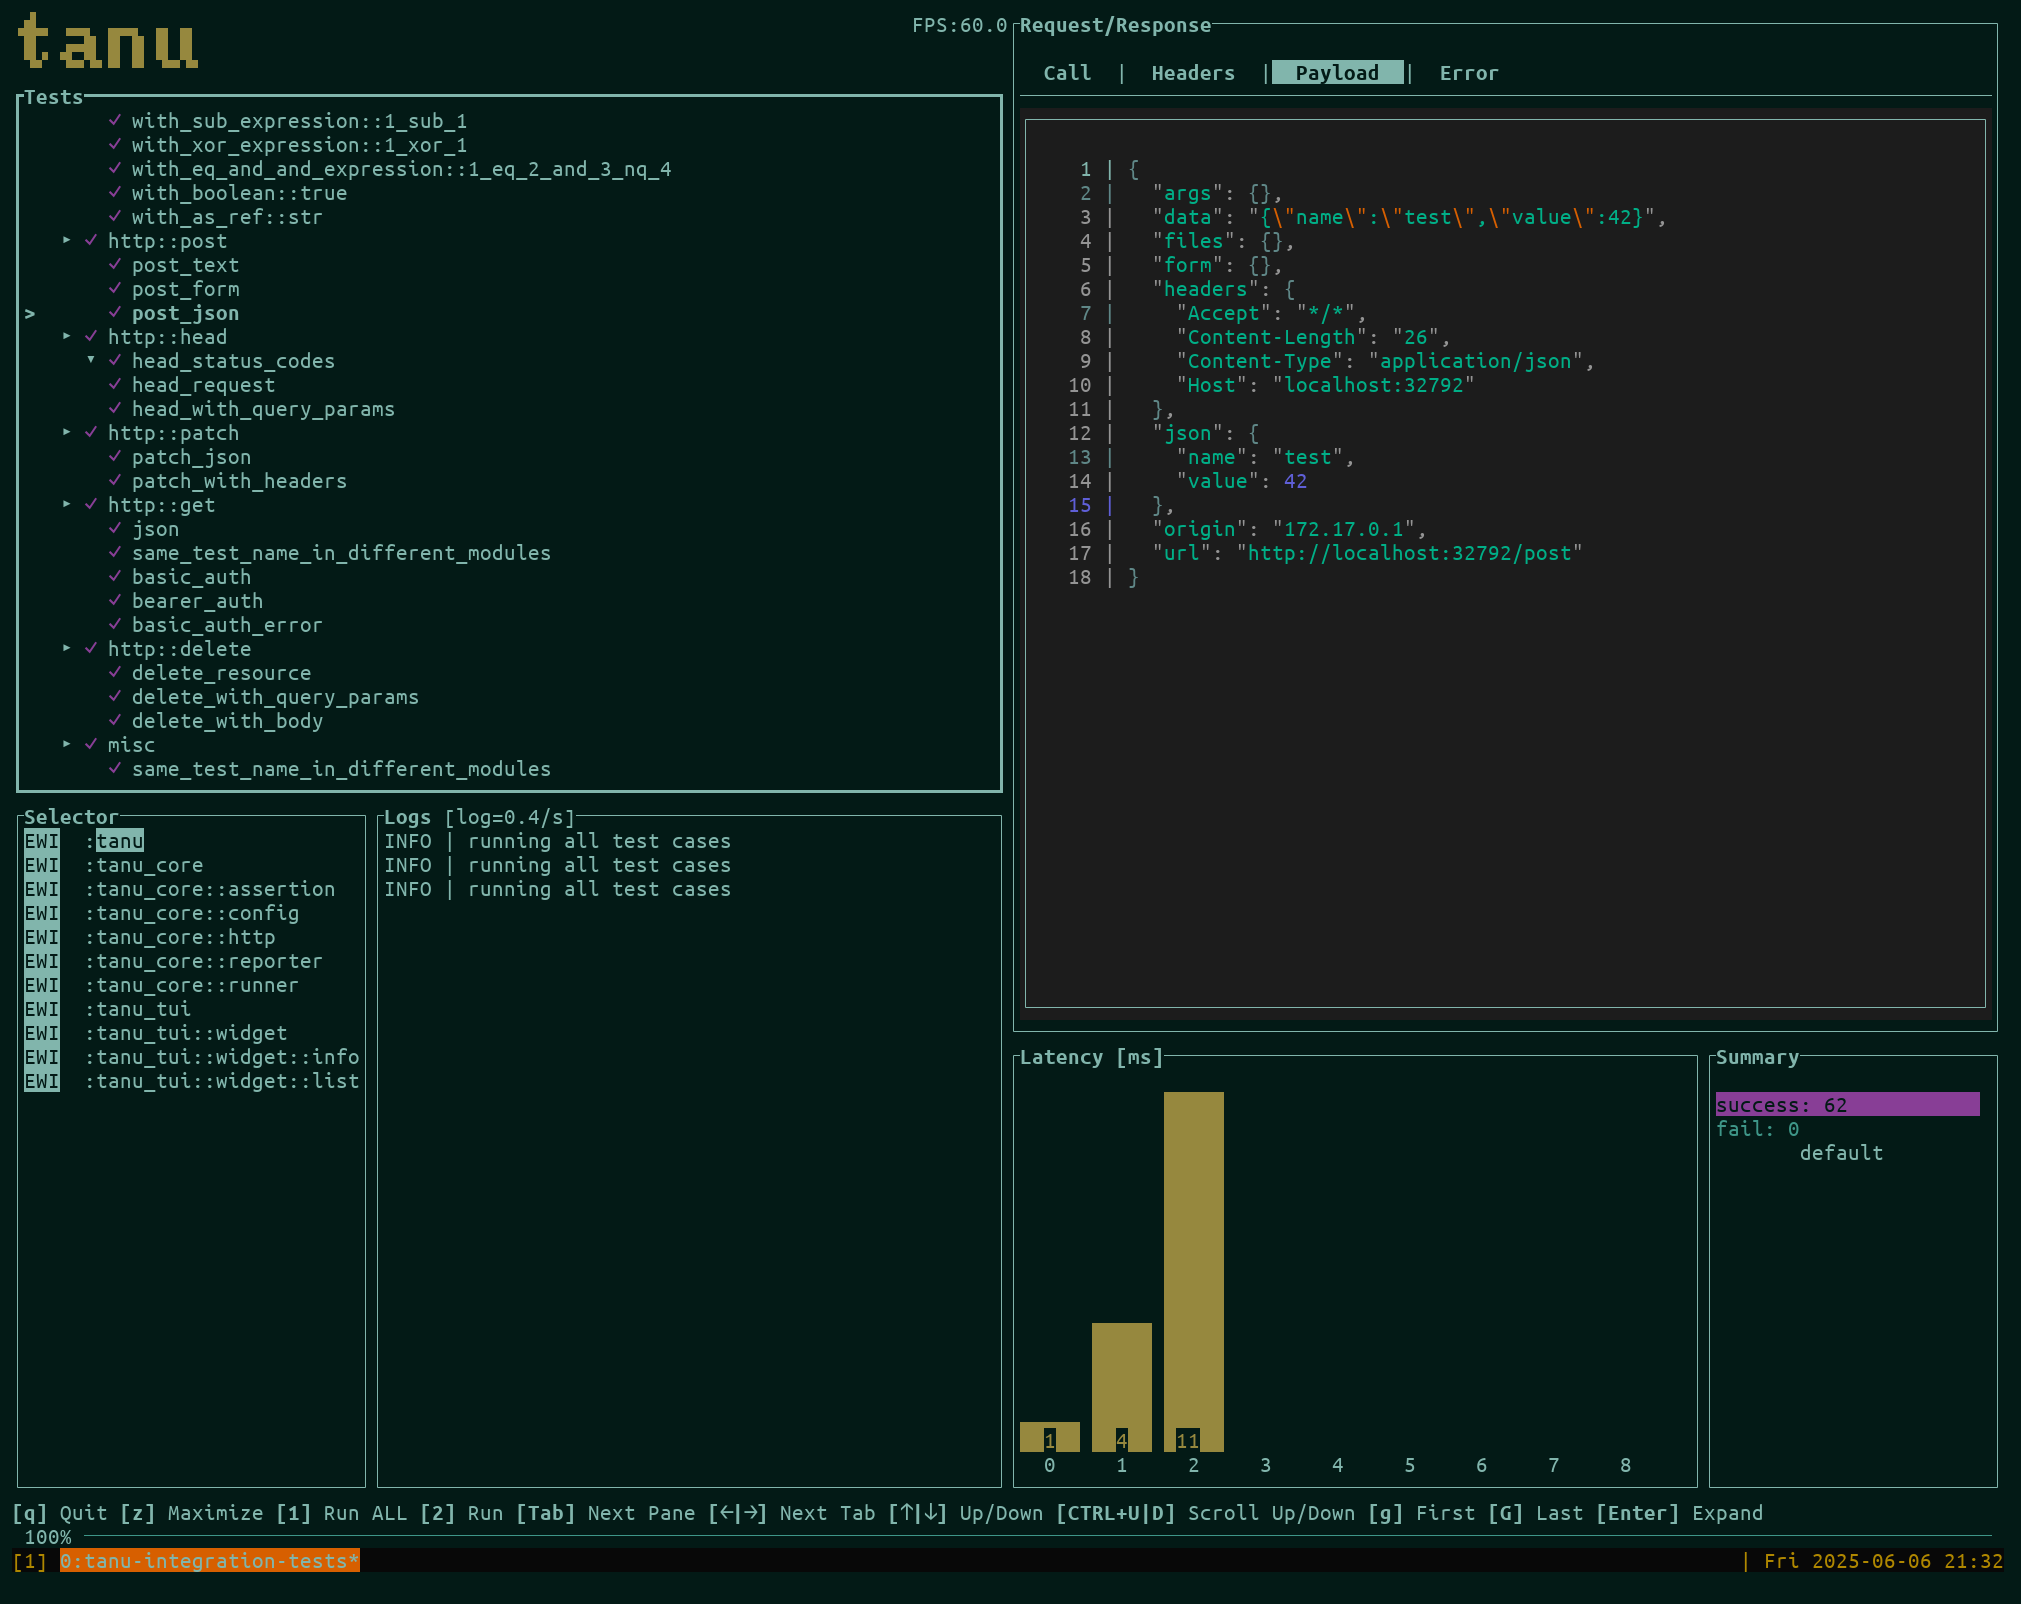
Layout
The screen has a status bar at the top, a key hint bar at the bottom, and several panes in between. Press Tab or click a pane to focus it.
| Area | Contents |
|---|---|
| Status bar | Run state (idle, running, passed, failed), pass/fail/retry/not-run/filtered counts, the pass rate when some tests failed, elapsed time, and projects. The theme button at the right end opens a drop-down list of TUI themes. |
| Tests | Tests grouped by module. With several projects, each project has its own tab showing its pass count (or failures in red); the first row is the project itself, to run or inspect it as a whole. Each row shows its result, and tests also show call count, retries, and duration. Modules show passed/total. Tests excluded by test_ignore or test_only are listed dimmed with ⊘ and the reason; they are never run and are not counted in the totals. |
| Details | For a single HTTP or gRPC call: four tabs, Call, Headers, Payload, and Error (checks and error message). For a project, module, or a test with zero or several calls: an overview with counts, failed tests, slowest tests, and a list of calls. |
| Logs | Log output from tanu and from your tests, in a short pane under the tests. The pane follows new logs until you scroll up; each log shows the Rust module it came from, which L hides or shows. |
| Charts | Timeline: one lane per worker, with a bar for each test from its start to its end, blue if it passed and muted red if it failed (the same colors as the latency chart). The selected test is highlighted in light blue. The title shows the wall time, the number of workers, and how busy they were. Latency: histogram of request latencies on a log scale (<1ms, 1ms, 2ms, 5ms, 10ms, …) with p50, p95, p99, and max. The calls of the selected test are light blue at the bottom of each bar, and error responses (HTTP 4xx/5xx, non-OK gRPC status) are a muted red, since they are often expected. Both charts are shown side by side; when maximized they are stacked. |
Key bindings
Press ? in the TUI to see all key bindings.
Global
| Key | Action |
|---|---|
r (or 2) |
Run the selected project, module, or test |
R (or 1) |
Run all tests |
Tab / Shift+Tab |
Focus the next / previous pane |
[ / ] |
Previous / next Details tab |
/ |
Search tests and modules by name |
f |
Cycle the status filter: all, failed, passed, not run, filtered |
n / N |
Jump to the next / previous failed test |
z |
Maximize or restore the focused pane |
t |
Cycle the TUI color theme |
T |
Cycle the payload color theme |
? |
Show or hide key bindings |
Esc |
Clear the search and filter; quit if none is active |
q |
Quit |
Tests
| Key | Action |
|---|---|
j / ↓, k / ↑ |
Move the cursor down / up |
g / Home, G / End |
Jump to the top / bottom |
Ctrl+D / Ctrl+U |
Move half a page down / up |
Enter / Space |
Expand or collapse a project, module, or test (to show its calls) |
← / → |
Previous / next project tab (with a single project: same as h / l) |
h |
Collapse, or go to the parent |
l |
Expand, or go to the first child |
While searching, type to filter the list. Enter keeps the query and Esc cancels it.
Details
| Key | Action |
|---|---|
h / ←, l / → |
Previous / next tab |
j / ↓, k / ↑ |
Scroll down / up |
g / Home, G / End |
Scroll to the top / bottom |
Ctrl+D / Ctrl+U |
Scroll down / up half a page |
Logs
| Key | Action |
|---|---|
j / ↓, k / ↑ |
Scroll down / up |
Ctrl+D / Ctrl+U, PgDn / PgUp |
Scroll down / up half a page |
g / Home, G / End |
Scroll to the top / bottom; at the bottom, new logs are followed |
h / ←, l / → |
Show fewer / more log levels |
L |
Show or hide the module path of each log (shown by default) |
Charts
| Key | Action |
|---|---|
z |
Maximize the charts; the timeline lanes get taller when there is room |
Mouse
Click a pane to focus it, click a row to select it (click again to expand it), and click a tab (details or project) to open it. Click the ✓, ✘, or ○ count in the status bar to show only those tests; click it again to show all tests. Click a bar in the timeline to select that test. The mouse wheel scrolls the pane under the cursor.
Configuration
- Concurrency defaults to the number of logical CPU cores; change it with
-corrunner.concurrency. - Payload colors come from
[tui] payload.color_theme. To try others, click the theme button at the bottom right of the Payload tab to open a drop-down list: moving through it (j/k, arrows, or the mouse wheel) previews each theme,Enteror a click keeps it, andEscor a click outside restores the previous one.Tcycles to the next theme without the list. See TUI theme. - Credential masking and
runner.max_body_sizeapply to the Payload view just as they do to CLI output. - Set
TANU_TUI_DEBUG=1to show the frame rate in the status bar.
Tips
- Press
fto show only failed tests, thennto step through them. - Maximize the Details pane with
zto read large payloads. - Press
ron a module to run just that module while iterating on it. - Use
--log-leveland--tanu-log-levelto control how much appears in the Logs pane. See Command Line Options.